Client portal
Your client portal.
Your numbers, goals and decisions in one place between packs. It's included on every tier and updated each cycle, when your signed pack is published.
Your login only ever sees your own business. The screens below show a demo business with made-up figures.
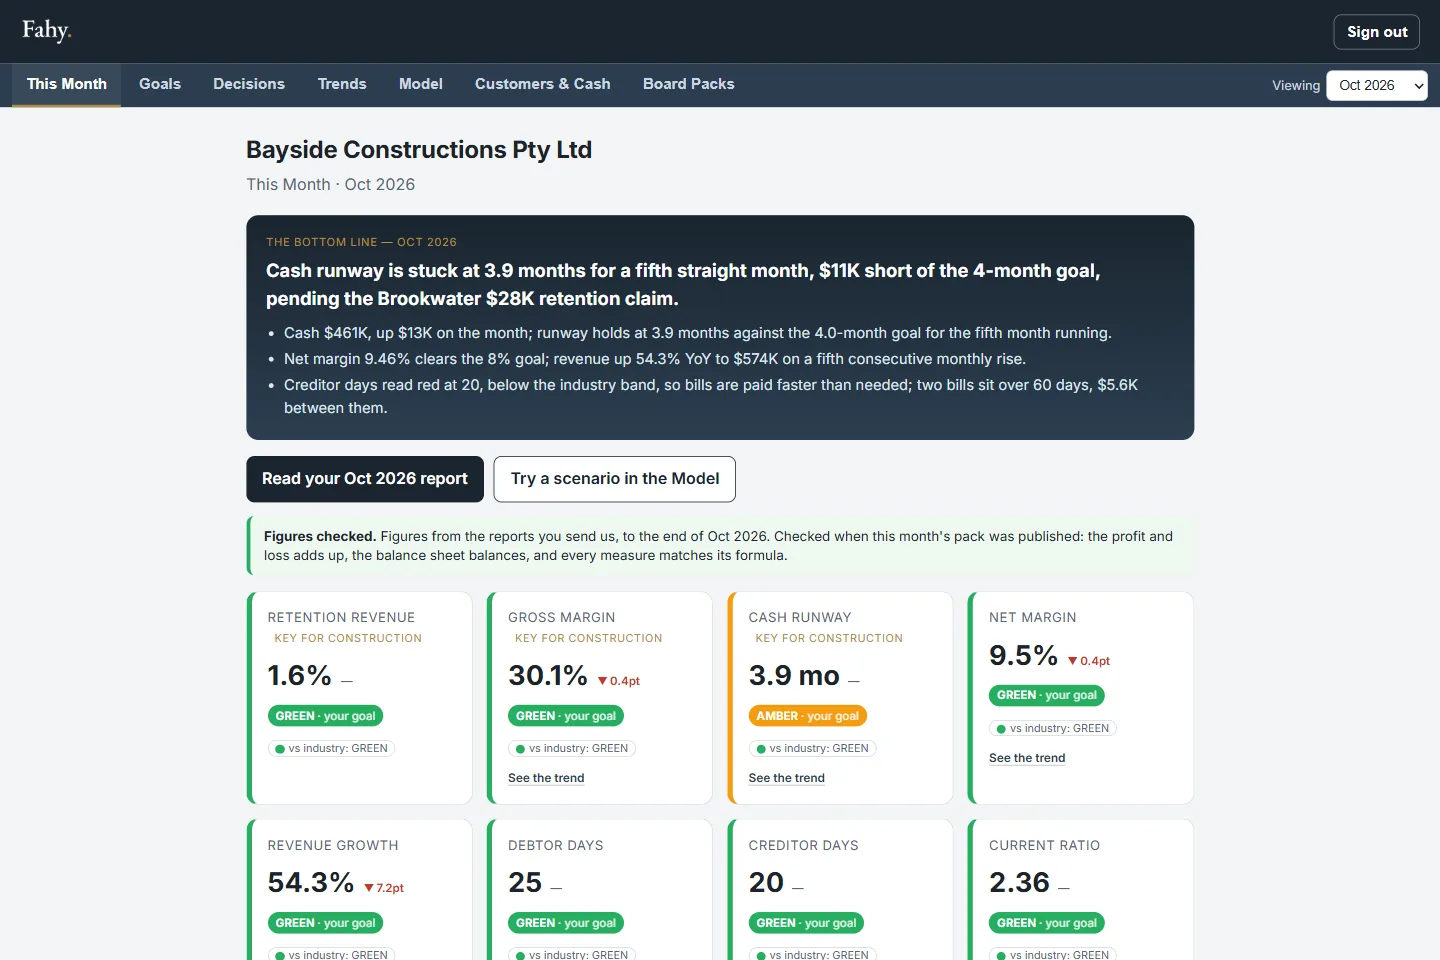
Tab 1 of 7 · This Month
Where the month landed.
The headline from your signed board pack sits at the top. Below it are eight KPI tiles, each with a traffic light against your own goal and against your industry, and the decisions still open.
Click a tile to see its trend.
Tab 2 of 7 · Goals
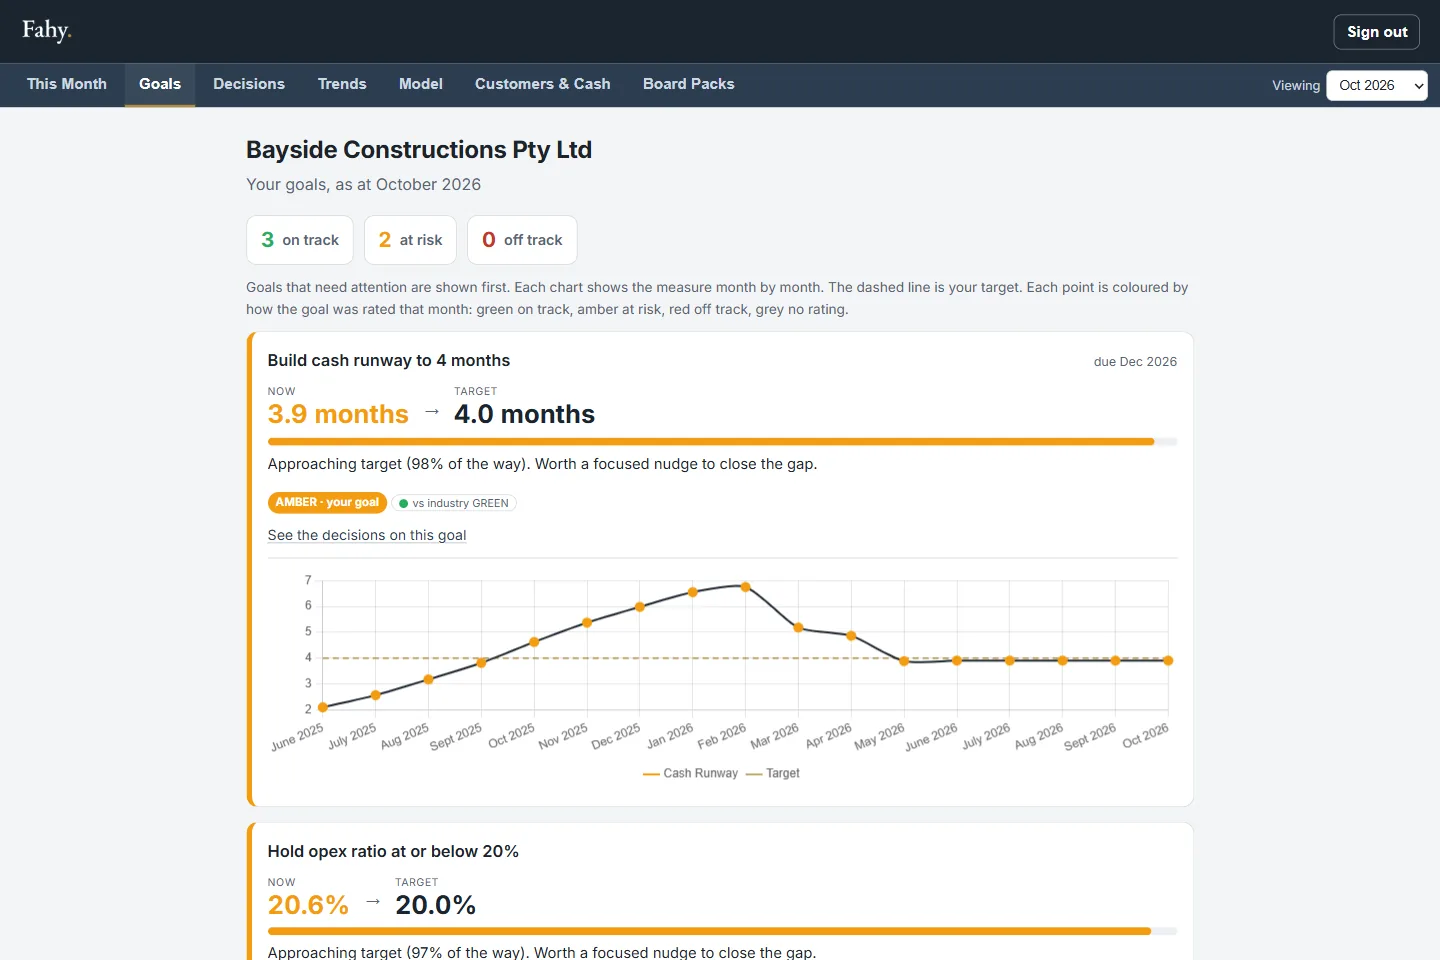
Every goal, month by month.
Each goal is charted against its target, and every month on the chart is coloured by how it was rated. The month picker rewinds the whole tab to any earlier month.
You'll also find the monthly reads on your goal plan and your longer-term objectives.
Tab 3 of 7 · Decisions
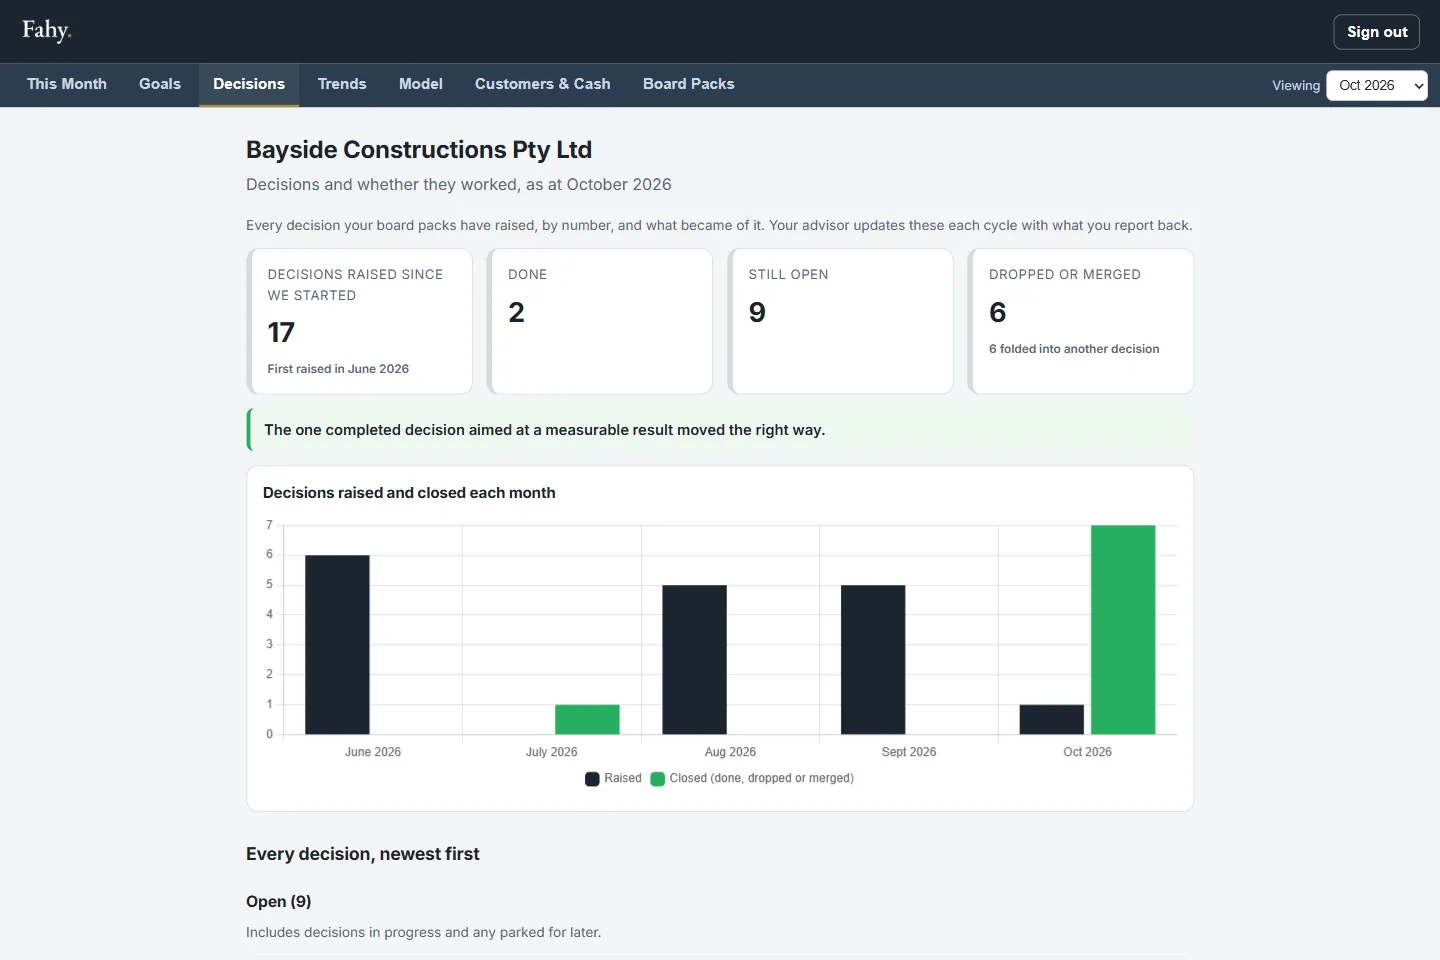
What was decided, and whether it worked.
It lists every decision your board packs have raised, whether it was done, and whether it moved the measure it aimed at.
Below that is Our calls, scored: every forecast the pack has made and how it turned out.
Tab 4 of 7 · Trends
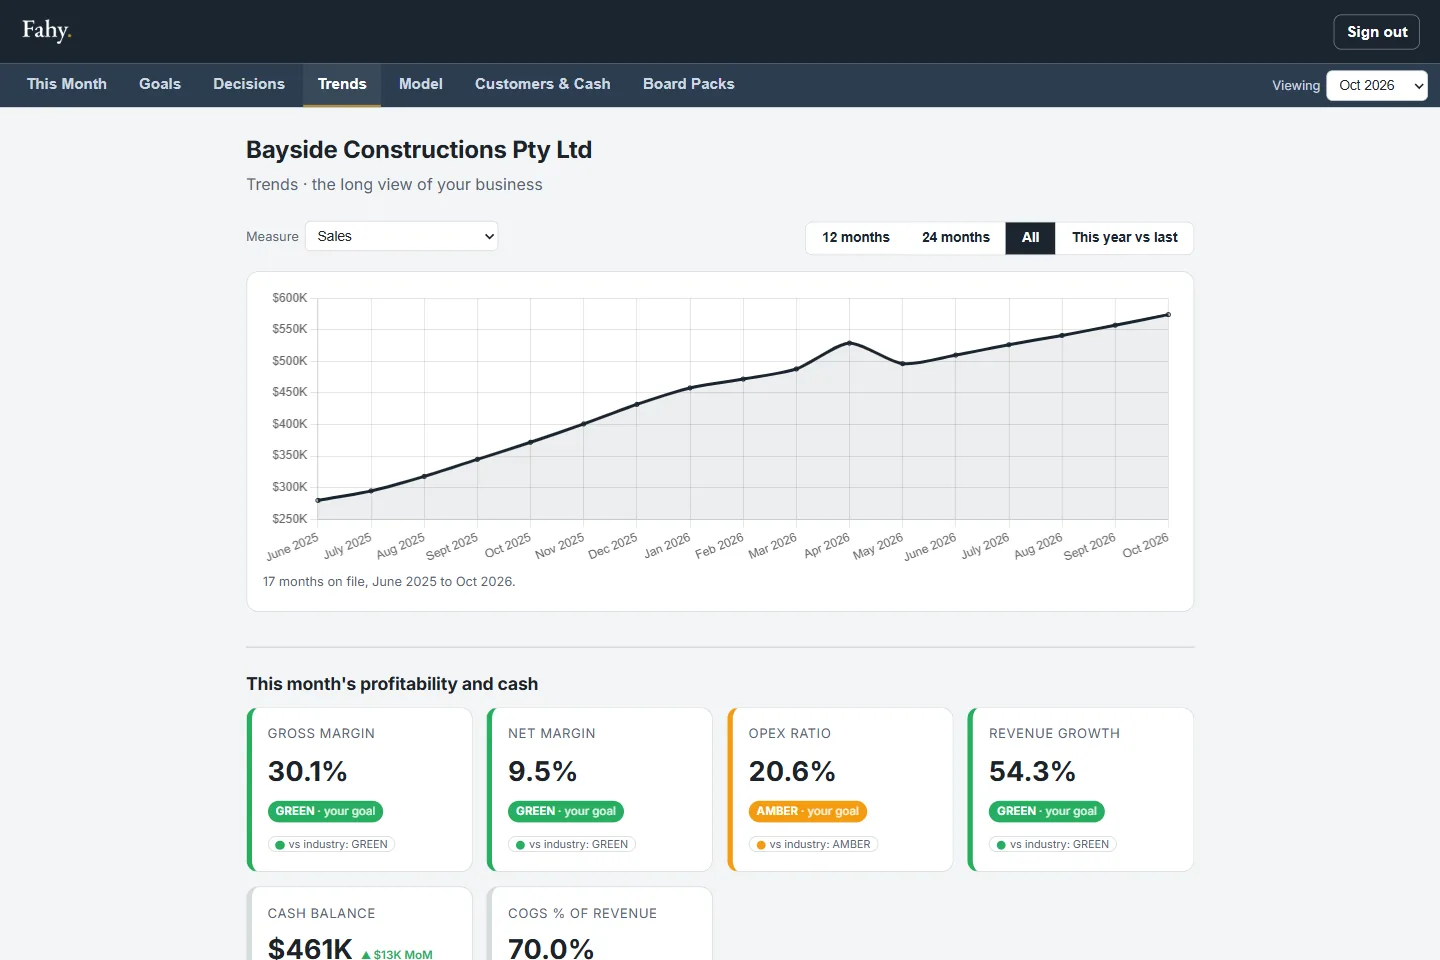
The long view.
Pick any measure and see it over every month on file, or lay this year over last.
Tab 5 of 7 · Model
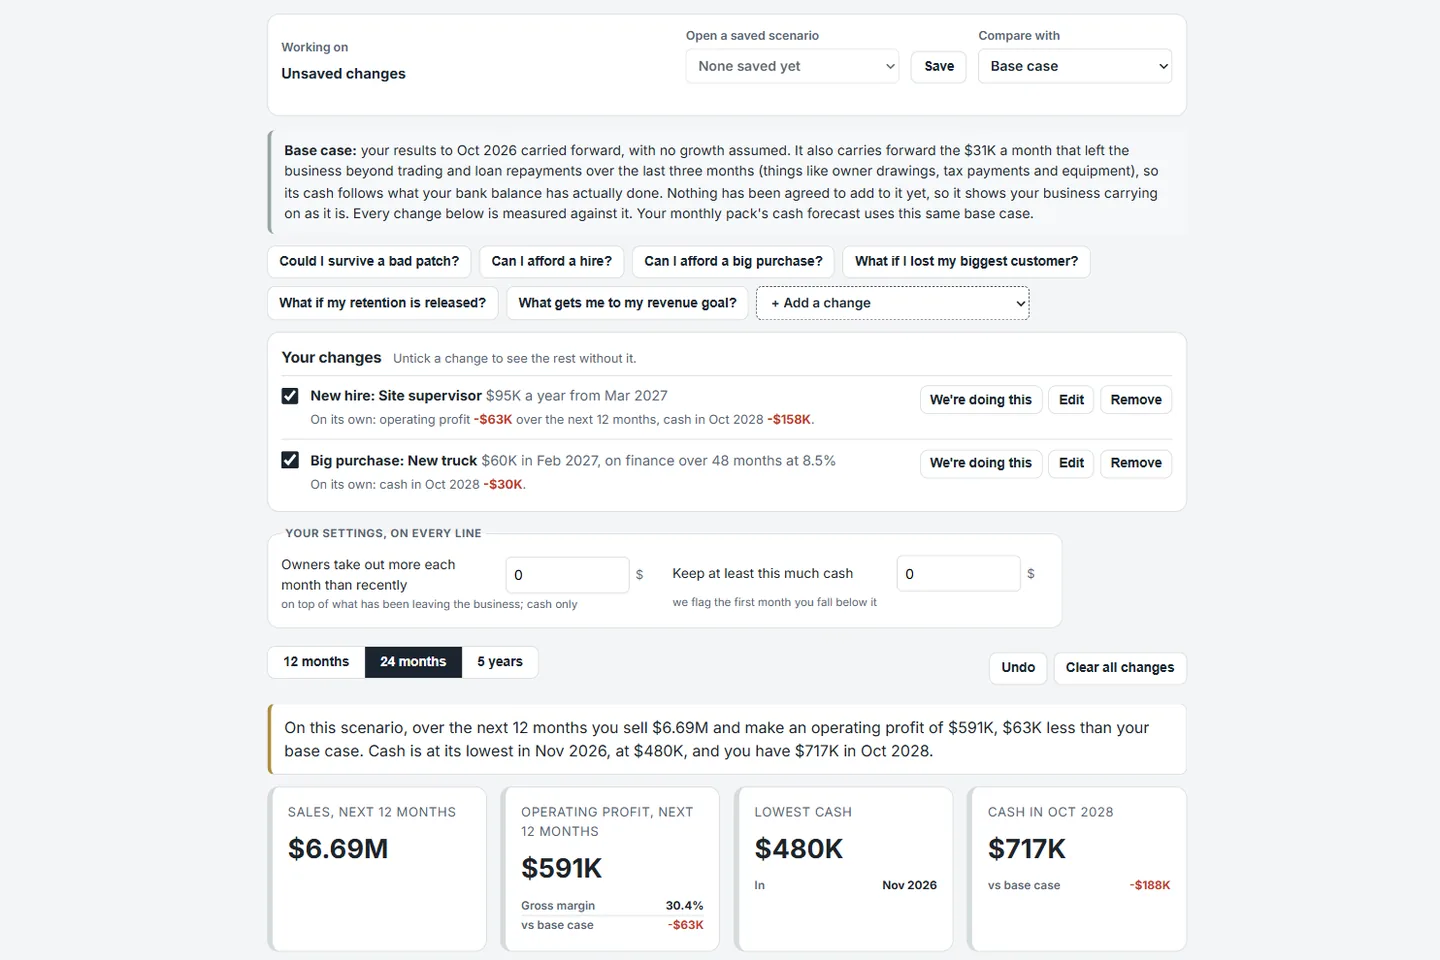
Plan on your own figures.
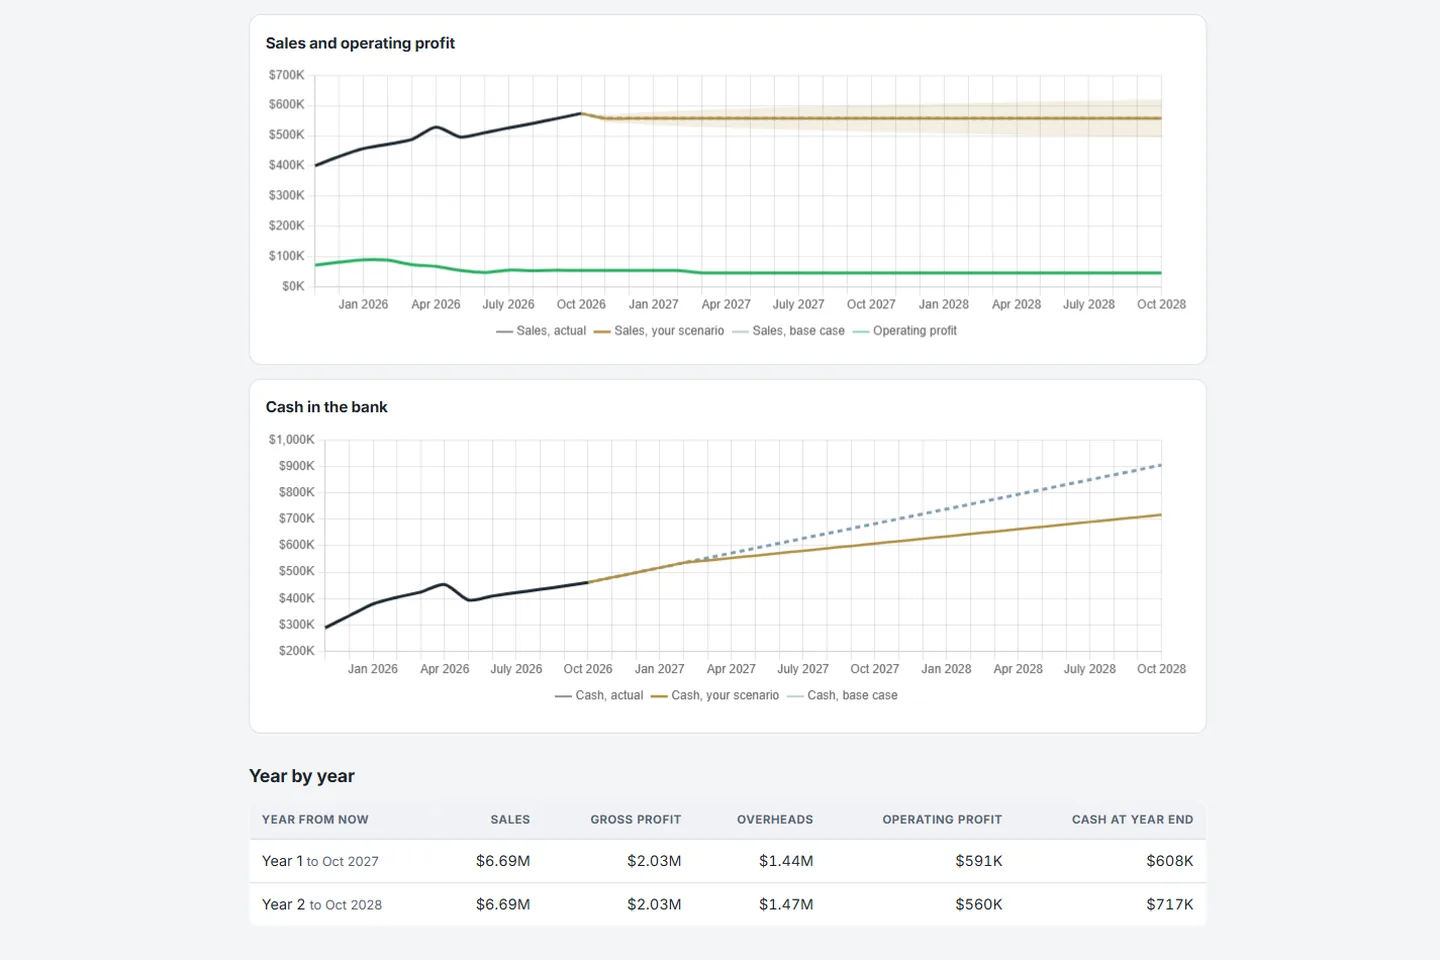
The Model starts from your own figures and works before tax. Run a forecast, save the scenarios you want to keep, and compare two side by side.
Every scenario is measured against your base case: your results carried forward, including the cash that actually leaves the business, plus the decisions you've agreed with us. Your monthly pack forecasts from the same base case, so the two tell the same story.
You can also price each revenue line, and set a budget for the year that you revise as you go.
Tab 6 of 7 · Customers & Cash
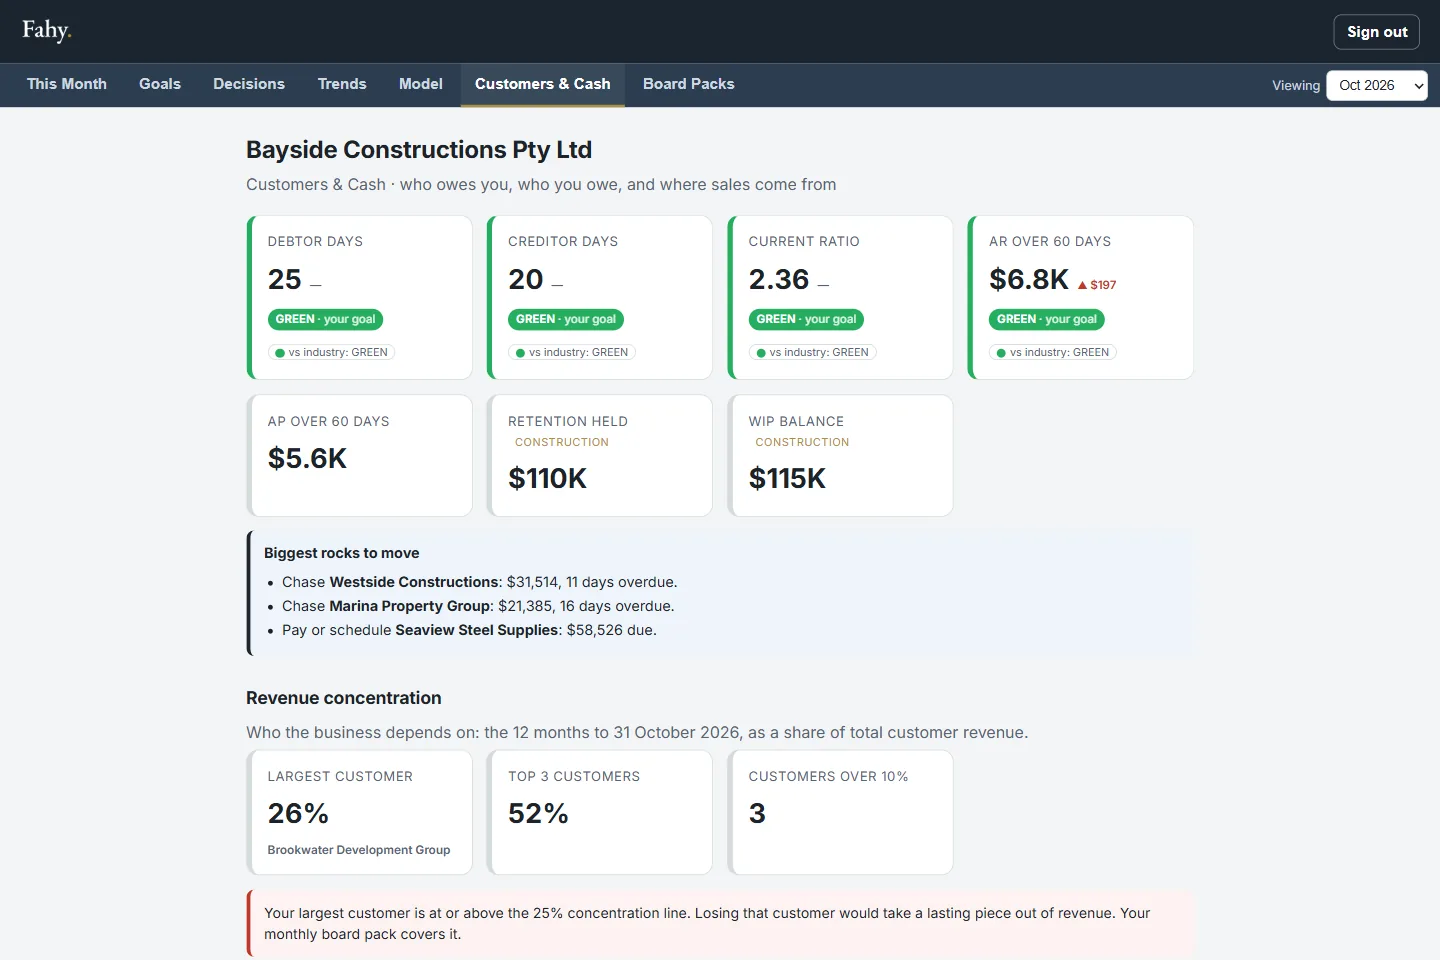
Who owes you, and who you owe.
Both sides are listed invoice by invoice, with the ageing colour-coded. It also shows how much of your revenue comes from your biggest customers, your revenue lines and, for builders, job costing.
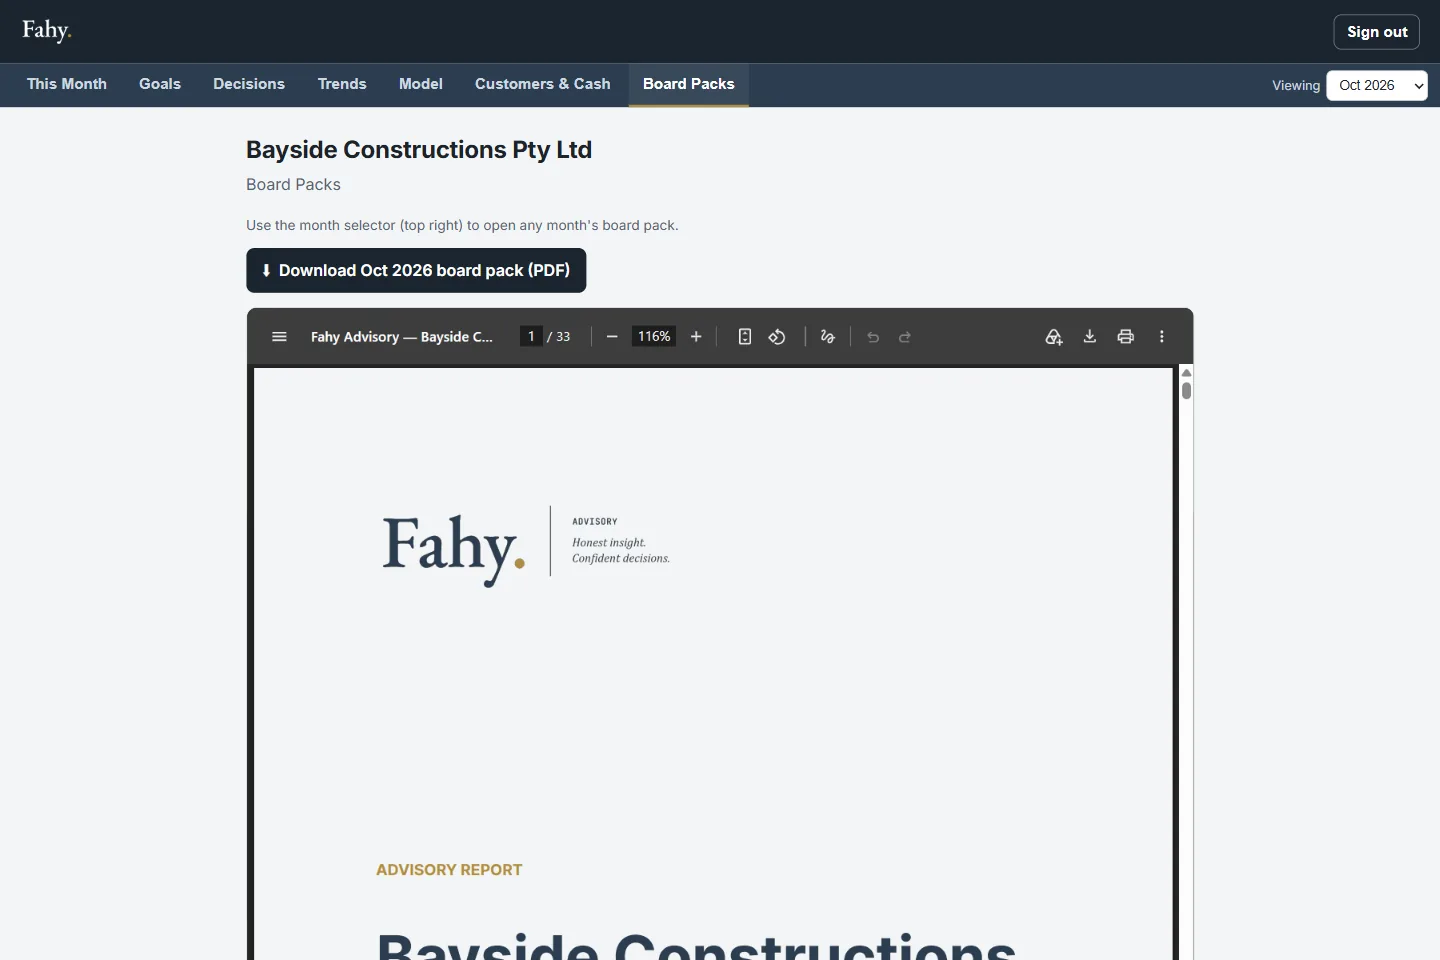
Tab 7 of 7 · Board Packs
Every pack, on file.
Every month's signed board pack is kept here, and you can read any of them in the browser.
See it for yourself.
The demo portal has all seven tabs, set up for a demo business. When you'd like to see it on your own numbers, book a call.
A demo business with made-up figures. Have a look around; nothing you do is saved.